Fluid responsiveness and Functional hemodynamic monitoring
What is fluid responsiveness?
-
Fluid responsiveness is an increase of stroke volume > 10-15% after the patient receives a bolus of 500 ml of crystalloid (Bolus by definition means that it has to be pressure bagged and given over 5-10 minutes).
-
Fluid responsiveness is also known as “volume responsiveness”.
-
Even though there are many ways to determine fluid responsiveness, the only definitive test for fluid responsiveness is the actual fluid challenge.
-
Fluid responsive patients have a ‘preload reserve’ and will increase stroke volume (and usually cardiac output) when fluid is administered. The presumption is that increased cardiac output will lead to increased oxygen delivery (DO2) and increased tissue oxygenation — but this is not always the case, and may actually harm the patient by causing fluid overload.
When to consider fluid responsiveness:
Hypovolemia is usually due to external fluid losses caused by bleeding or losses from the GI or urinary tracts, skin, or internal losses due to extravasation of blood or transudation of body fluids. Relative hypovolemia follows increases in venous capacitance due to release of inflammatory mediators as in sepsis or as a side effect of drugs. In these distributive forms of circulatory failure, the intravascular volume may be normal, but the increases in the capacity of the vascular bed preclude adequate venous return.
Fundamentally, the only reason to give a patient a fluid challenge is to increase the stroke volume (SV; by at least 10–15%) and improve organ perfusion. It is therefore crucial during the resuscitation phase of critically ill patients to determine not only the volume status but also whether the patient is fluid-responsive or not.
Studies have shown that just a little over 50% of septic patients actually respond to fluid challenge. Crit Care Med. 2009 Sep;37(9):2642-7. Also, the response in fluid responders is short lived and 85% of the infused bolus will redistribute into interstitial space in 4 hours. In critically ill patients with endothelial injury and leaky capillaries, less than 5% of a fluid bolus remains intravascular after 90 minutes. Anaesth Intensive Care. 2011 Nov;39(6):1022-9 , Ann Intensive Care. 2014 Aug 1;4:25 , Ann Surg. 2012 Jul;256(1):18-24.
Physiology of fluid responsiveness
Venous return is determined by the pressure gradient between the peripheral veins and the right atrium (CVP). The venous system can be divided into two theoretical compartments, the unstressed and stressed volume. The intravascular volume that fills the venous system to the point where intravascular pressure starts to increase is called unstressed volume, whereas the volume that stretches the veins and causes intravascular pressure to increase is called the stressed volume.
The mean circulatory filling pressure (MCFP) is conceptualized as the pressure distending the vasculature, when the heart is stopped (zero flow) and the pressures in all segments of the circulatory system have equalized. The stressed venous system is the major contributor to the filling pressure. It is usually in the range of 8–l0 mm Hg and is the major determinant of venous return. The venous system has a large vascular capacitance and a constant compliance in which an increased blood volume is associated with a relatively small change in the MCFP. However, because of the restraining effects of the pericardium and cardiac cytoskeleton, the diastolic compliance of the normal heart reduces as distending volume increases. Consequently, with large volume fluid resuscitation, the cardiac filling pressures (particularly on the right side, i.e. CVP) increase faster than the MCFP, decreasing the gradient for venous return.
Organ blood flow is determined by the difference in the pressure between the arterial and venous sides of the circulation. The mean arterial pressure (MAP) minus the CVP is therefore the overall driving force for organ blood flow. A high CVP therefore decreases the gradient for venous return, while at the same time decreasing organ driving pressure and therefore blood flow. Venous pressure has a much greater effect on microcirculatory flow than the MAP. Hence, if MAP is within an organ’s auto regulatory range, the CVP becomes the major determinant of capillary blood flow.
According to the Frank-Starling principle, as LV end-diastolic volume (i.e. preload) increases, LV stroke volume (SV) also increase until the optimal preload is achieved, at which point the SV remains relatively constant.
Fluid administration will only increase SV if two conditions are met:
-
If the fluid bolus increases the stressed blood volume causing the mean circulating filling pressure to increase greater than the increase in CVP and thereby increasing the gradient for venous return.
-
Both ventricles are functioning on the ‘ascending limb’ of the Frank-Starling curve. Also, there should be no abnormal pathology in the pathway from right atrium to aorta.
Hence, Stroke volume is dependent on 3 factors
-
Preload: It is the primary determinant of cardiac output. We assume that fluids are the best way to increase preload. But, vasopressors can cause venoconstriction and increase preload too.
-
Contractility
-
Afterload
Only if all 3 factors are working properly, can we expect a fluid bolus to result in increased cardiac output. A detailed analysis of these 3 factors are described in another chapter – Basics of hemodynamics.
What happens after we give fluids?
Fluid administration expects to increas the stressed blood volume, increasing the gradient between the mean systemic filling pressure (MSFP) and right atrial pressure (CVP), thereby increasing venous return. In patients who are on the ascending limb of the Frank-Starling limb, the increased venous return results in an increase in stroke volume and cardiac index.
Because the primary purpose of fluid administration is to increase blood flow to vital organs, the intent is to prevent or reduce adverse effects on cardiac function. In accord with the Frank-Starling principle, the effects of fluid infusion on stroke volume usually predominate over increase in filling pressures. However, if filling pressures increase as in heart failure, they may become life threatening, with increase in left ventricular diastolic pressures, thereby resulting in acute pulmonary edema.
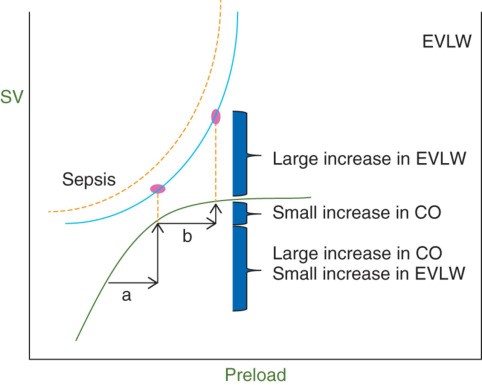
In sepsis, there is a persistent vasodilatory state with increased fluid leak into the interstitial space. So, even if the patient is fluid responsive, aggressive fluids will only lead to a small increase in cardiac output with a huge increase in extravascular lung volume. Br J Anaesth. 2014 Apr;112(4):617-20
Limitations of fluid challenge:
-
Only 50% of hemodynamically unstable patients are ‘fluid responders’. In essence, we are giving fluids to 50% of our patients for no reason.
-
Septic patients could have sepsis induced cardiomyopathy and may not only not respond to fluid challenge but may actually go into fluid overload along with drop in cardiac output. Also, sepsis is usually a hyper dynamic state with an increased cardiac output. There is no evidence to suggest that any further increase in cardiac output to supernormal values is beneficial ( Already disproved with dobutamine and blood transfusions as per original river’s trial to increase oxygen delivery).
-
The physiological effects of fluid bolus typically disappear in about an hour. Crit Care. 2012 Jan 25;16(1):302. Also, initial clinical and physiological improvement following fluid boluses may not lead to long-term improvement in patient-orientated outcomes.
-
In healthy individuals, 85% of an infused bolus of crystalloid will redistribute into the interstitial space after four hours. Anaesthesiol Intensive Ther. 2014 Nov-Dec;46(5):361-80
-
The FEAST trial found that fluid bolus resuscitation had 50% higher mortality in African children with septic shock in under-resourced settings. FEAST trial , BMC Med. 2013 Mar 14;11:67.
-
Recent trials of early goal-directed therapy (EGDT) suggest that good outcomes can be achieved with < 2-3L of fluid boluses administered in the resuscitative phase (e.g. ARISE, PROMISE, PROCESS). PRISM Study
-
In a study on African HIV pts, an early resuscitation protocol including intravenous bolus therapy had increased in-hospital mortality (48.1%) compared with usual care (33.0%). JAMA. 2017 Oct 3;318(13):1233-124
-
The CLASSIC trial : There was a trend toward improvement in ICU patients with septic shock who received restrictive fluids (fluid only give if signs of severe hypo perfusion). It was not powered to find a statistically significant difference in these secondary outcomes.
Static tests of fluid responsiveness:
-
Blood pressure – Arterial hypotension is a nonspecific sign, which could be due to heart failure, tamponade, vascular obstruction, as in massive pulmonary embolism, or vasodilation quite independent of intravascular volume. Even though, maintaining an adequate blood pressure is necessary, tracking blood pressure changes with IV fluids have been shown to an unreliable test of fluid responsiveness.
-
Heart rate – Volume deficits are typically compensated for by increase in heart rate, which maintain cardiac output when stroke volumes are reduced. This response is inconsistent, especially in patients with intrinsic heart disease and during treatment with commonly used antiarrhythmic drugs. Stress, pain, fever, anemia, or drugs all produce endogenous adrenergic stimulation with compensating increases in heart rate and vasoconstriction.
-
Urine output – Absence of an improvement in urine output is thought to be suggestive of absent fluid responsiveness. However, this is a flawed thinking. For example, in ATN, even if we bombard them with a ton of fluids with a resultant increase in stroke volume, urine output may not increase and absent of improvement doesn’t mean an absent fluid responsiveness.
-
Capillary refill time – Patients with underlying lymphedema may have poor capillary refill and absence of improvement doesn’t mean an absent fluid responsiveness.
-
CVP / PAOP – According to the Frank-Starling relationship, stroke volume increases with CVP until a plateau is reached. It may thus sound attractive to try to reach a CVP value that is close to the plateau. Admittedly, reduced filling pressures in the right atrium or pulmonary artery are more likely in settings of hypovolemia, and increased filling pressures are more likely in settings of either right or left heart failure. However, neither is sufficiently reliable for predicting response to a fluid load. Also, estimates of intravascular volume based on any given level of filling pressure do not reliably predict a patient’s response to fluid administration. CVP should never be used as a test of volume status or volume responsiveness. Intensive Care Med. 2018 Sep;44(9):1591-1592 , Crit Care Med. 2013 Jul;41(7):1774-81 , Crit Care Med. 2007 Jan;35(1):64-8
Even though, CVP can’t be used to assess fluid responsiveness, it can be used as a safety limit to avoid fluid overload.
In fluid responsive states, fluids should lead to increase in cardiac output and should therefore not increase the CVP. When patients are no longer fluid responsive, all the excess fluid will increase preload and thereby CVP. Accordingly, changes in CVP during fluid challenge should be analyzed together with changes in cardiac output; a large increase in CVP with minimal change in cardiac output indicates poor tolerance to fluids, whereas minimal change in CVP together with an increase in cardiac output indicates fluid responsiveness. An excellent article on common misconceptions about CVP can be found here.
-
Single lactate levels: Lactate clearance has been shown to be a better prognostication sign then an absolute lactate value.
-
ScVO2 – low ScVo2 often in sepsis, there is cellular dysfunction at the mitochondrial level and it may be falsely high in spite of hypervolemia.
-
Dry mouth, Poor skin turgor, Hypernatremia, Hemoconcentration – Signs of dehydration are especially misleading. Extravascular volume deficits do not become clinically apparent until they exceed 10% of body weight.
Dynamic tests of fluid responsiveness / Functional hemodynamic monitoring
Estimates of intravascular volume based on any given level of filling pressure do not reliably predict a patient’s response to fluid administration. Admittedly, reduced filling pressures in the right atrium or pulmonary artery are more likely in settings of hypovolemia, and increased filling pressures are more likely in settings of either right or left heart failure. However, neither is sufficiently reliable for predicting response to a fluid load. This lack of reliability based on a static measurement led to the concept of measuring changes in pressures after a specified bolus volume of fluid, a more dynamic measure, which had a greater likelihood of unmasking hypovolemia.
-
Fluid challenge
-
PLR
-
CVP variability
-
IVC collapsibility or distensibility
-
SVV / PVV
-
PCO2 gap
-
ECHO with VTI measurements
-
End-expiratory occlusion test
Fluid / Volume challenge:
Fluid bolus therapy is widely administered to patients with undifferentiated hypotension and for patients with severe sepsis.
-
The rationale and evidence base for this approach to hypotension management is controversial
-
In septic shock, it is inferred that the distributive shock state causes decreased preload and thus decreased cardiac output, contributing to decreased organ perfusion. Administering fluid boluses is thought to increase blood volume, increasing venous return and cardiac output and thus organ perfusion
In USA, the most common reasons for a fluid challenge are hypotension and oliguria. Most common misconceptions about fluid challenge can be found here. Crit Care Med. 2006 May;34(5):1333-7
The time-honored method of assessing preload responsiveness is to administer a relatively small intravascular volume bolus rapidly and observe the subsequent hemodynamic response in terms of blood pressure, pulse rate, cardiac output, SvO2 and related measures. However, being preload responsive does not equate to requiring fluid resuscitation. Normal individuals are preload responsive but do not require resuscitation.
Passive leg raising
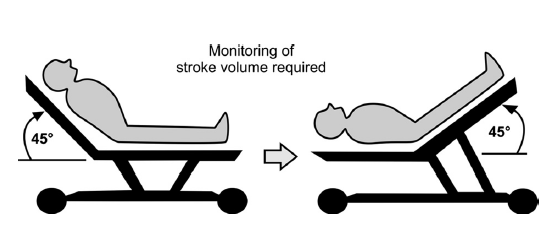
PLR to 45° transiently increases venous return in patients who are preload responsive. It is a reversible maneuver that mimics a 500-700 cc of fluid challenge. More than 10% increase in stroke volume or descending aortic blood flow is considered as a positive test. A 10% increase in pulse pressure can sometimes be used as a positive test.
A recent meta-analysis determined that the area under the curve for PLR for determining fluid responsiveness was 0.95 and was not affected by spontaneous breathing or cardiac dysrhythmias. Intensive Care Med. 2010 Sep;36(9):1475-83.
PLR is best performed by both elevating the lower limbs to 45 degrees, while at the same time lowering the patient into the supine position from a 45 degree semi-recumbent position. This technique has the advantage of both increasing cardiac preload from the shift of venous blood from the legs as well as the abdominal compartment.
The advantages of this approach are that it is easy perform, induces only a transient and reversible volume challenge, yields volume challenges proportional to individual body size, and can be repeated as needed to reassess preload responsiveness. However, the blood volume mobilized by leg raising is dependent on total blood volume and so could be small in severely hypovolemic patients. Crit Care Nurse. 2017 Apr;37(2):32-47
Limitations: Intraabdominal pressure >15, brain injury (a relative contraindication), severe dehydration, Cor-pulmonale. Some speakers question the utility of PLR in patients who are not deeply sedated and mechanically ventilated as there might be a sympathetic response to trendelenburg positioning which might confuse results of the passive leg raise testing.
PLR effects must be assessed by a direct measurement of cardiac output and not by the simple measurement of blood pressure. Indeed, reliability of PLR is poorer when assessed by using arterial pulse pressure compared with cardiac output. Intensive Care Med. 2013 Jan;39(1):93-100.
Pain, cough, discomfort, and awakening could provoke adrenergic stimulation, resulting in mistaken interpretation of cardiac output changes. Hence, these things should be kept in mind. A misleading sympathetic stimulation can be suspected if PLR is accompanied by a significant increase in heart rate, which normally should not occur.
Changes in CVP during spontaneous breathing:
With spontaneous inspiration, CVP decreases and venous return increase due to decrease in intrathoracic pressure. An inspiratory decrease in CVP of more than 1 mmHg in the setting of an intrathoracic pressure decrease of more than 2 mmHg accurately predicts preload responsiveness.
IVC collapsibility and distensibility
Spontaneous inspiration lowers right atrial pressure by reducing intra-thoracic pressure. Inspiration, therefore, increases the gradient for venous return and can augment cardiac output. IVC collapsibility more than 50% is indicative of fluid responsiveness. Alternatively, IVC collapsibility index greater than 18% is indicative of fluid responsiveness. J Crit Care. 2017 Oct;41:130-137
However, IVC collapsibility is affected by more than volume status. For example, in patients with massive ascites, IVC collapses during inspiration due to pushing of diaphragm into abdomen leading to increase in abdominal pressure and thereby collapsing IVC. The patient might have abdominal hypertension but we may falsely administer more fluids with the hope of improving preload and thereby cardiac output. In those situations, all that was needed was a therapeutic paracentesis.
Also, in patients getting huge tidal volumes or with extremely forceful inspiratory efforts can decrease intra-thoracic pressure enough to collapse the great veins entering the thorax, including the IVC. That doesn’t mean that they are hypovolemic.
In patients on mechanical ventilation, inspiration leads to an increase in RA pressure with a decrease in venous return and cardiac output. IVC becomes distended and IVC distensibility index of more than 18% is indicative of fluid responsiveness.
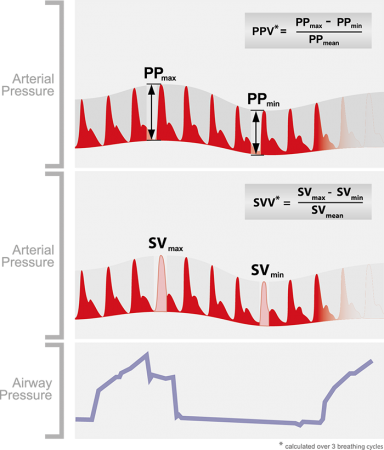
Systolic pressure variation:
During spontaneous breathing, BP decreases with inspiration and increases with expiration. On mechanical ventilation, this reverses due to changes in intrathoracic pressure. A normal systolic pressure variation is around 5-10mm Hg. A systolic pressure variation of more than 10-15% is an indicator of fluid responsiveness. A physiological basis can be found here.
Other causes of increased systolic pressure variation are LV dysfunction, tamponade, constrictive pericarditis, massive pulmonary embolism, bronchospasm, dynamic hyperinflation, pneumothorax, increased intrathoracic pressure and increased intra-abdominal pressure.
SVV Variation or Pulse pressure variation:
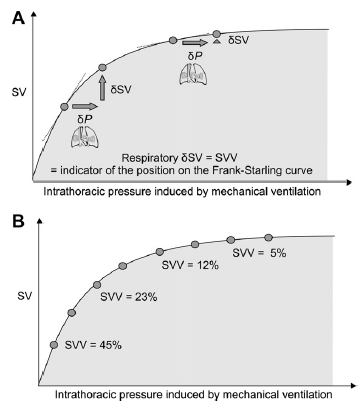
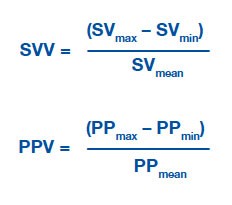
Variations in stroke volume (SV) and pulse pressure (PP) occur as a result of interactions between the cardiovascular and respiratory systems. Arterial pulse pressure rises during spontaneous inspiration, and falls during expiration as a result of changing intra-thoracic pressures. During mechanical ventilation this phenomenon is reversed and is called reverse pulsus paradoxus, or paradoxical pulsus, or respiratory paradox. This variation can be measured and is called SVV. A cutoff value of >13% for SVV/PPV had a sensitivity of 94% and specificity of 96% to discriminate between fluid responders and nonresponders.
During inspiration with positive pressure ventilation, the increase in intrathoracic pressure reduces RV preload, and increase RV afterload. Hence, RV stroke volume decrease with inspiration on mechanical ventilation. However, positive pressure ventilation also cause an increase in LV preload and decrease in LV afterload, resulting in increase in stroke volume. In theory, patients who exhibit a SVV greater than ~10-15% may be hypovolemic and therefore may respond positively to a fluid challenge. Alternatively, pulse pressure could be used instead which is considered a poor man’s stroke volume.
SVV and PPV are not indicators of actual preload but of relative preload responsiveness. A SVV/PPV >13% predicts preload responsiveness. Crit Care. 2014 Nov 27;18(6):650
Studies have shown that PPV is more reliable predictor of volume responsiveness than SVV, and this probably relates to the fact that PPV is directly measured and SVV relies on pulse contour analysis, which makes a number of assumptions. Crit Care Med. 2009 Sep;37(9):2642-7 , Turk J Anaesthesiol Reanim. 2017 Aug;45(4):210-217
Note: SVV or PPV not always reflect fluid responsiveness. For example, when the cardiac contractility is very low and patient is on mechanical ventilation, the positive pressure will increase the contractility and decrease the afterload increasing the stroke volume and cardiac output. In this case, the improvement in stroke volume is seen during inspiration. (In normal patients on positive pressure ventilation, stroke volume decreases during inspiration). In the above scenario, if we give more fluids assuming there is SVV, the heart may fail further.
Current literature only supports the use of SVV if patient meets the following criteria:
-
Mechanical ventilation: 100% mechanically (assist control mode) ventilated and fixed respiratory rates.
-
No Spontaneous breathing
-
Tidal volumes at least 8cc/kg
-
No arrhythmias: SVV is unreliable in presence of arrhythmias.
-
Normal lung compliance ( i.e no ARDS)
Other considerations, which could potentially limit the reliability of any device using SVV are:
-
Heart rate (HR) >150 beats per minute
-
Heart rate to respiratory rate ratio <4:1
-
Respiratory rate > 35
-
Open chest
-
? Severe MS/MR/ AS/AR
-
? Beta blockers
-
Pneumoperitoneum
-
Poor arterial waveform
-
An open abdomen has been shown to reduce SVV by 40-50%
-
Decreased lung compliance and pulmonary hypertension may diminish SVV and PPV as predictors of fluid responsiveness.
-
Decreased extra pulmonary compliance ( obesity, ascites, pleural effusion, chest wall edema)
Causes of increased SVV without hypovolemia (False positives)
-
Tamponade
-
Constrictive pericarditis
-
LV dysfunction
-
Severe RV systolic dysfunction
-
Severe pulmonary hypertension
-
Massive ascites.
-
Bronchospasm
-
Dynamic hyperinflation
-
Pneumothorax
-
Raised intrathoracic pressure
-
Raised intraabdominal pressure
-
Norepinephrine may decrease SVV
-
Vasodilators may increase SVV
-
High PEEP may increase SVV
Causes of decreased SVV in spite of hypovolemia (False negatives)
-
ARDS with low lung compliance (The accuracy of PPV goes down with decrease in lung compliance). Crit Care Med. 2012 Jan;40(1):152-7
-
Low tidal volumes
PCO2 gap (Venous CO2 – PaCO2):
PCO2 gap is a surrogate for cardiac output. It is increased in hypo perfusion and increased CO2 production. PCO2 gap >6 mmHg suggests a persistent shock state that may be amenable to fluid resuscitation +/- intrope support. Intensive Care Med. 2013 Sep;39(9):1653-5 , World J Crit Care Med. 2016 Feb 4; 5(1): 47–56

End expiratory occlusion test:
In patients on mechanical ventilation, the positive pressure during inspiration will decrease the preload and drop the stroke volume resulting in SVV. However, if we put a 15 sec pause at end expiration, there won’t be any such increase in intra thoracic pressure and hence, no change in SVV. After end expiratory occlusion, if cardiac index increases by 5%, then it indicates fluid responsiveness. However, for this test to be valid, patient should not be having active inspiratory efforts during end expiratory occlusion and the PEEP should not be more than 15cm.
ECHO:
With an ECHO, we can measure VTI and aortic outflow diameter. Both of these indices are used to calculate stroke volume and cardiac output. However, if the probe is not in the correct axis, we could underestimate the stroke volume and cardiac output. Any improvement in VTI after a fluid bolus is suggestive of fluid responsiveness.
What does fluid responsiveness even mean in the clinical context?
-
Fluid responsiveness does not mean that a patient should be given fluids. Preload responsiveness doesn’t equate to needing fluids. It just means that patient is likely to increase his stroke volume / cardiac output, if given a fluid bolus. It is for us to figure out if an increase in cardiac output is beneficial at that point of time.
-
However, if a patient has low cardiac output that requires correction, fluid responsiveness means that stroke volume (and usually cardiac output, unless heart rate falls) will improve, if fluids are given.
PEARLS:
-
Right atrial pressure is the back pressure that opposes venous return. Positive pressure ventilation, cardiac tamponade and right ventricular afterload increase RA pressure and can decrease the gradient for venous return.
-
Fluids do not increase vascular tone in vasoplegic / septic shock.
-
All these tests for monitoring fluid responsiveness and tools / machines that are based on these principles have to be used in the clinical context. Blindly following these machines and driving the patients into fluid overload is foolish and reckless behavior.
-
Fluids are administered blindly even if patients are not responding. It’s almost like giving the same antibiotics even when cultures show resistance to them.