Static hemodynamic monitoring variables
The utility of each variable as a single absolute value is questionable. Some individual hemodynamic values are useful primarily as threshold monitors. For example, because a primary determinate of organ perfusion is perfusion pressure, systemic hypotension to below a certain threshold is clinically relevant. Furthermore, elevation in central venous pressure (CVP; i.e. >10 mmHg) reflects right ventricular (RV) pressure overload, although this gives no information on the precise etiology involved. Other hemodynamic values can only be interpreted relative to metabolic demand. For example, because blood flow varies to match metabolic requirements, which in turn can vary considerably, there is no one specific value of cardiac output or oxygen delivery that can be defined as ‘normal’. These characteristics of blood flow reflect either ability or an inability to meet the metabolic demands of the body.
Blood pressure:
Arterial blood pressure is not a single pressure but a range of pressure values from systole and diastole. Mean arterial pressure best approximates the organ perfusion pressure in noncardiac tissues, as long as venous or surrounding pressures are not elevated.
Because blood pressure is a regulated variable, a normal blood pressure does not necessarily reflect hemodynamic stability. Organ systems also tend to auto regulate their blood flow such that organ-specific blood flow remains constant within a wide range of blood pressures if metabolic rate is unchanged, and varies with changes in local metabolic rate. Thus, there is no threshold blood pressure value that defines adequate organ perfusion among organs, between patients, or in the same patient over time. However, because arterial pressure is a primary determinant of organ blood flow, hypotension (mean arterial pressure <65 mmHg) is always pathological.
Pressure = Resistance X flow: R x F or MAP = SVR x CO
Central venous pressure:
CVP is the back-pressure to systemic venous return. Normal is 0-8 and CVP is elevated only in disease.
>1 mmHg decrease in CVP (or IVC diameter) during spontaneous inspiration indicates fluid responsiveness.
Cardiac output (CO) is defined as the amount of blood ejected from the ventricles in one minute (in liters/minute). Normal cardiac output is between 4-8 L/min. However, there is no absolute normal cardiac output, only an adequate or inadequate.
Cardiac output (CO) is calculated by multiplying the heart rate (HR) by the stroke volume (SV).
CO =HR X SV
Cardiac index (CI) is the cardiac output adjusted for body surface area. The normal value for this is between 2.5 and 4.2 liters per minute, per square meter of body surface area. If the CI falls below 1.8 L/min/m2, the patient may be in cardiogenic shock.
Stroke volume (SV) is the amount of blood ejected from the left ventricle each time the ventricle contracts. The stroke volume is the difference between end-diastolic volume (EDV) and end-systolic volume (ESV). Normal stroke volume is between 60 and 120 ml/beat.
When stroke volume is expressed as a percentage of the end-diastolic volume, it is referred to as the ejection fraction (EF). A normal left ventricular EF is approximately 55- 70%.
Arterial Blood Oxygen Content:
Hemoglobin carries 97% of oxygen and 2% is dissolved in plasma. Together, oxygen bound to hemoglobin and oxygen dissolved in plasma, is called arterial oxygen content or CaO2 = (Hb x1.34 x SaO2) + (0.003 x PaO2). Hemoglobin can carry 1.34 ml of oxygen per gram of hemoglobin.
The oxyhemoglobin dissociation curve indicates the relationship between oxygen saturation of hemoglobin and the partial oxygen pressure, and how it releases oxygen to the tissues or how it retains oxygen on the hemoglobin.
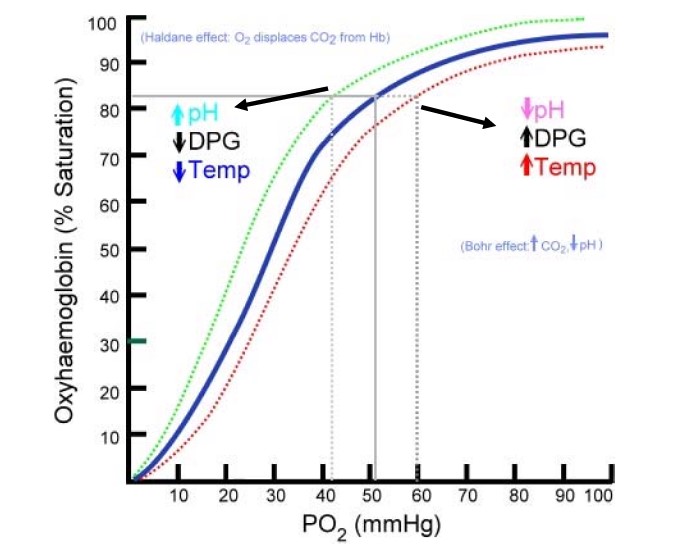
Because of the higher partial oxygen pressure of saturated hemoglobin, oxygen can diffuse from the hemoglobin to the lower partial oxygen pressure in the tissues.
Under normal circumstances a PO2 of 50 mmHg saturates approximately 82% of the hemoglobin. However, there are certain conditions that cause a shift of the curve to the left, which allows for 82% hemoglobin saturation with a PO 2 of only 42 mmHg. This shift to the left (Bohr effect) increases the affinity of oxygen to the hemoglobin, but makes it more difficult to release oxygen to the tissues, and is caused by an increase in pH, hypothermia and low 2,3 DPGs. 2,3 DPG or 2,3-Disphosphoglycerate is an organophosphate that affects the affinity of oxygen to the hemoglobin. A shift to the right decreases the affinity of oxygen to the hemoglobin, but makes it easier to release oxygen to the tissue. This is caused by high 2, 3-DPG, hyperthermia, and a low pH. Hence, in acidosis like lactic acidosis, there is decreased affinity of oxygen to hemoglobin and increased release of oxygen to tissues.
Oxygen Delivery: cardiac output x oxygen content. Its components are
-
Oxygen content: CaO2 = (SO2 x 1.36 x Hb ) + (0.0031 x PO2 )
-
Arterial Oxygen Delivery: CaO2 x CO x 10 = 20.1 vol % x 5 x 10 = 1005 ml/min
-
Venous Oxygen Delivery: CvO2 x CO x 10 = 15.5 vol % x 5 x 10 = 775 ml/min
Oxygen consumption can be measured by subtracting the volume of O 2 (arterial oxygen content) leaving the heart from the volume of O 2 (venous oxygen content) returning to the heart. Normal range 200 – 250 ml/min. Under normal conditions oxygen consumption is 25%. However, during stress response the tissues are capable of extracting 80% of oxygen.
Although SvO2 above 70% does not necessarily reflect adequate tissue oxygenation, a persistently low SvO2 (>30%) is associated with tissue ischemia. A low SVO2 can indicate that either the O 2 extraction is increased or the O 2 delivery is decreased. This can be caused by anemia, decreased cardiac output, low arterial oxygen saturation or increased oxygen consumption. Treatment of low SVO 2 can consist of increasing the cardiac output by increasing heart rate, optimizing preload, modulating afterload, increasing SaO2, administering positive inotropes or improving the oxygen carrier capacity by means of a blood transfusion. It is more difficult to decrease O 2 demand. Sedatives and neuromuscular blocking agents can help to decrease muscle activity and prevent shivering.
Mixed Venous Saturation & Central Venous Oxygenation
Under normal circumstances the body consumes 25% of the oxygen delivery, resulting in a return of 75% to the right side of the heart. Therefore, normal SVO 2 values are between 60% and 80%, indicating a balance between DO 2 and VO 2.
A low SVO2 can indicate a decrease in cardiac output (hypovolemia, myocardial infarction, increased intra-thoracic pressure), in oxygen saturation (pulmonary edema, ARDS, low FiO2), in hemoglobin level (anemia, hemorrhage, dysfunctional hemoglobin), or an increase in oxygen consumption (pain, anxiety, restlessness, tachycardia, shivering, hyperthermia, burns).
Stroke volume
It is the volume of blood pumped out of the heart with each heartbeat. If the stroke volume drops, the body will compensate by increasing the heart rate to maintain cardiac output. Pulse pressure is a poor man’s stroke volume.
Stroke volume is affected by three factors, preload, afterload, and contractility.
-
Preload: Preload is defined as the amount of stretch on the cardiac myofibril at the end of diastole. The amount of stretch is directly affected by the amount of fluid volume in the ventricle thus preload is most directly related to fluid volume.
Preload is determined by the volume of blood filling the ventricle at the end of diastole. In essence, the greater the filling volume, then the greater the stretch of the myocardial muscle fibers. The more the myocardial muscle fibers are stretched, the greater the force of the myocardial contraction and potentially the greater the stroke volume to a physiological limit. As preload (fluid volume) increases, cardiac output will also increase until the cardiac output levels off. If additional fluid is added after this point, cardiac output begins to fall. (Frank-starling mechanism).
How is preload measured? There is not a practical way to measure myofibril stretch in living beings, nor is there a method to measure ventricular end-diastolic volume. Because of this, pressures within the cardiovascular system are measured and used as a rough indicator of fluid volume. This correlation is true only in a limited sense, because the pressures measured are affected by more than just the fluid volume present. Preload pressures are also affected by intrathoracic pressure, intra-abdominal pressure, and myocardial compliance. The key to remember is that pressure is not equal to volume. The pressure is trended as an indicator of volume status. It is clinically acceptable to measure the pressure required to fill the ventricles as a measure of left ventricular end-diastolic volume (LVEDV).
Left ventricular preload can also be clinically assessed via the pulmonary artery (PA) catheter by obtaining the pulmonary artery wedge pressure (PAWP), also known as the pulmonary artery occlusion pressure (PAOP), more commonly referred to as the “wedge” pressure. Normal PAWP/PAOP can range from 6-12 mm Hg. Right ventricular preload is assessed by obtaining the central venous pressure (CVP). A normal CVP can be from 0-8 mm Hg. Both CVP and PAWP are reflective of right/left ventricular end diastolic volumes.
Signs of inadequate preload include poor skin turgor, dry mucous membranes, low urine output, tachycardia, thirst, weak pulses and flat neck veins. Signs of excess preload in a patient with adequate cardiac function include distended neck veins, crackles in the lungs, and bounding pulses.
Insufficient preload is commonly called hypovolemia or dehydration. When insufficient volume is present in the vascular tree, the sympathetic nervous system is stimulated to release the catecholamines, epinephrine and norepinephrine. These hormones cause increased heart rate and arterial vasoconstriction. If these patients are treated with catecholamine drugs rather than receiving volume infusions, the tachycardia becomes very pronounced and the vasoconstriction can become severe enough that the organs fail and the distal extremities become ischemic. The first step in treating any form of hemodynamic instability is to assess the patient for signs of insufficient preload (e g volume or blood loss).
-
Afterload: Afterload is defined as the resistance that the ventricle must overcome to eject its volume of blood.
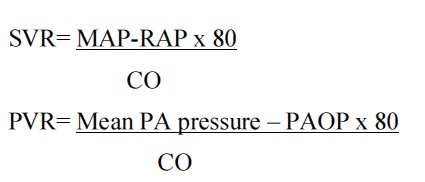
The most important determinant of afterload is vascular resistance. In the clinical setting the most sensitive indicator of left ventricular afterload is the systemic vascular resistance (SVR), and for right ventricular afterload it is pulmonary vascular resistance (PVR). The normal value for the SVR is 800-1200 dynes/sec/cm2. The normal values for the PVR is generally less than 250 dynes/sec/cm2.
High afterload increases myocardial work and decreases stroke volume. Patients with high afterload present with signs and symptoms of arterial vasoconstriction including cool clammy skin, capillary refill greater than 5 seconds, and narrow pulse pressure. (Note: Narrow pulse pressure is an indicator of both decreased stroke volume and increased afterload.)
Low afterload decreases myocardial work and results in increased stroke volume. Patients with low afterload present with symptoms of arterial dilation such as warm flushed skin, bounding pulses and wide pulse pressure.
-
Contractility & Compliance: contractility refers to the inherent ability of the cardiac muscle to contract regardless of preload or afterload status. Contractility is enhanced by exercise, catecholamines, and positive inotropic drugs. It is decreased by hypothermia, hypoxemia, acidosis, and negative inotropic drugs.
Myocardial compliance refers to the ventricle’s ability to stretch to receive a given volume of blood. Normally the ventricle is very compliant so large changes in volume will produce small changes in pressure. If compliance is low, small changes in volume will result in large changes in pressure within the ventricle.
Tissue Perfusion:
The whole point of assuring adequate cardiac output is to make sure the patient has adequate tissue perfusion. Tissue perfusion is the transfer of oxygen and nutrients from the blood to the tissues. When performing interventions designed to improve hemodynamics, the bottom-line is to improve tissue perfusion.
Many of the signs of inadequate preload, afterload and contractility also reflect poor tissue perfusion. These signs include: cool clammy skin, cyanosis, low urine output, decreased level of consciousness, metabolic acidosis, tachycardia, tachypnea, and hypoxemia.
Transducing CVP:
Transducer is a device that converts the pressure waves generated by vascular blood flow into electrical signals that can be displayed on electronic monitoring equipment.
Before the monitor can measure pressures, the transducer must be zeroed to atmospheric pressure. The purpose of this procedure is to make sure the transducer reads zero when no pressure is against it. To level the transducer, place the transducer at the level of the heart. This location is located at the 4th intercostal space, in mid-axillary line. If the transducer to too low (Raising the bed thereby the level of heart above the transducer), the reading will be falsely high. Conversely, if the transducer is too high, the reading will be falsely low.
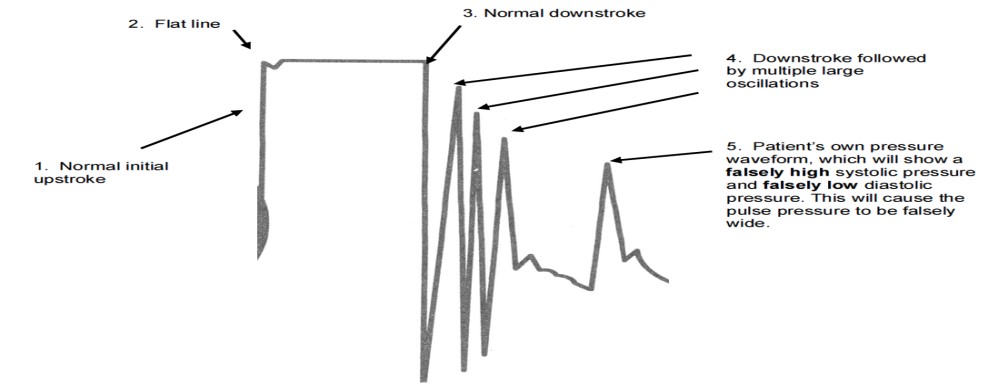
Square Wave Test:
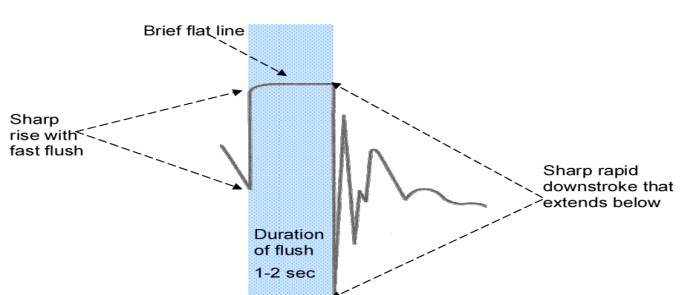
The ideal square-wave waveform consists of initial sharp upstroke produced by activation of the fast flush system, a flat line for the duration of activation of the fast flush system, and reflects the high pressure present in the flush bag. The sharp downstroke represents release of the fast flush device. The square wave should return quickly to baseline after a few rapid sharp waves called oscillations.
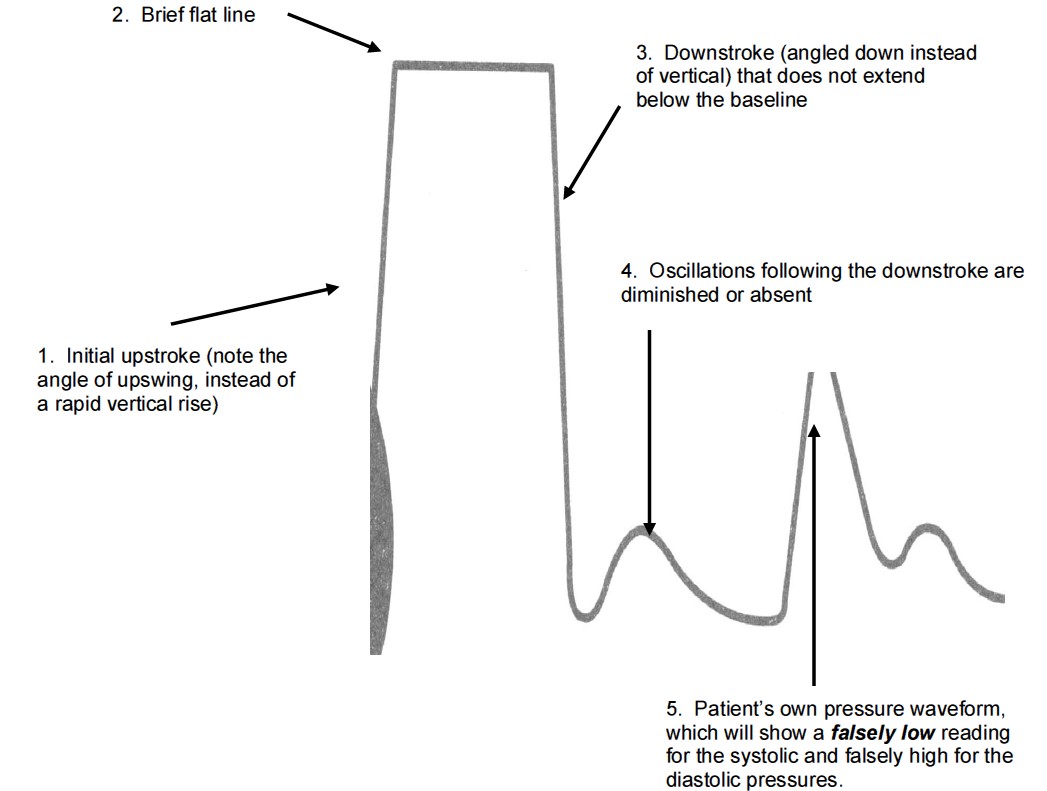
Overdamping:
Overdamping causes slurred upstroke, absent dicrotic notch, and loss of fine detail.
If the oscillations are sluggish and far apart, i.e. no overshoot or undershoot, the system is referred to as “overdamped”. Overdamping will cause reduced waveform magnitude and loss of some waveform components, and hence, will underestimate systolic pressures and overestimate diastolic pressures as a result.
Potential sources of overdamping include:
-
Distensible tubing – use only the semi-rigid tubing that comes with the transducer setup.
-
Overly long extension tubing
-
Air bubbles in the circuit
-
Small diameter catheters
Underdamping:
In an underdamped system, the square wave will be followed by multiple large oscillations. An underdamped system will overestimate systolic pressures and underestimate diastolic pressures.
Arterial Blood Pressure Monitoring:
The arterial pressure wave can be described in terms of its steady and pulsatile components. The steady component is the MAP, which is considered constant from aorta to peripheral large arteries.
Although DAP is roughly constant from aorta to periphery, SAP and therefore PP increase from aorta to periphery in young, healthy individuals. The systolic blood pressure is lowest in the aorta, and increases as the arteries become smaller. The mean arterial pressure (MAP) is the average driving force in the arterial system and is essentially the same in all parts of the body. Perfusion of all organs is dependent on MAP, not systolic or diastolic pressures. Only, coronary perfusion depends on diastolic pressures.
MAP = DBP + 1/3 X Pulse Pressure
Intra-Arterial Waveforms:
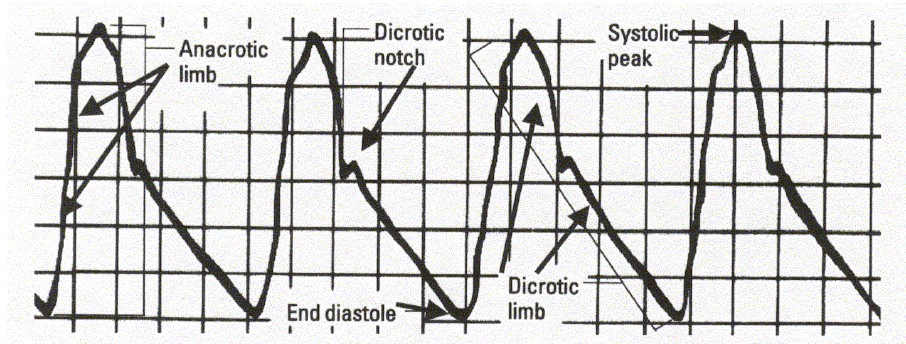
A normal arterial pressure waveform has five main components:
-
The anacrotic limb, or anacrotic rise, is a rapid upstroke that begins at the opening of the aortic valve in early systole. The steepness, rate of ascent, and height of this initial upswing is related to the contractility and stroke volume of the left ventricle.
-
The systolic peak represents the highest pressure generated by the left ventricle during myocardial contraction. This point marks the patient’s actual systolic blood pressure.
-
The dicrotic limb begins during late systole as the flow of blood out of the left ventricle starts to decrease.
-
The dicrotic notch marks the closure of the aortic valve and the beginning of diastole.
-
The end diastole landmark is the location at which the patient’s actual diastolic blood pressure is measured.
Central Venous Pressure (CVP) Monitoring:
The CVP is the pressure of the blood emptying into the right ventricle during diastole (the right ventricular end-diastolic pressure, or RVEDP). Normal CVP is 0-8. This rises about 3-5cm H2O during mechanical ventilation.
Any condition that causes increased intrathoracic pressure, such as pneumothorax, increased intra-abdominal pressure or mechanical ventilation will cause the CVP to be quite high, while end-diastolic volume is acutely low. Conditions that diminish elasticity or contractility and cause the right ventricle to become stiff, such as pericardial tamponade and myocardial ischemia or infarction, can also result in a high pressure with a low blood volume.
An elevated CVP indicates that the pressure within the right ventricle is increased above normal when the ventricle is full just prior to systole. This can be due to many factors, including fluid overload, myocardial infarction, cardiogenic shock, heart failure, pulmonary edema, COPD, pulmonary embolus, pneumothorax, pulmonary hypertension, pericardial effusion, or tamponade. Right-sided valvular disorders such as tricuspid regurgitation and pulmonic stenosis may also elevate the CVP reading.
A decreased CVP generally indicates a diminished volume of blood returning from the venous system to the right side of the heart.
CVP Waveform:

- a wave : This wave is due to the increased atrial pressure during right atrial contraction. It correlates with the P wave on an EKG.
- c wave : This wave is caused by a slight elevation of the tricuspid valve into the right atrium during early ventricular contraction. It correlates with the end of the QRS segment on an EKG.
- x descent : This wave is probably caused by the downward movement of the ventricle during systolic contraction. It occurs before the T wave on an EKG.
- v wave : This wave arises from the pressure produced when the blood filling the right atrium comes up against a closed tricuspid valve. It occurs as the T wave is ending on an EKG.
- y descent : This wave is produced by the tricuspid valve opening in diastole with blood flowing into the right ventricle. It occurs before the P wave on an EKG
-
The A wave occurs after the P wave of the ECG complex during the PR interval. It reflects the increased atrial pressure that occurs with atrial contraction during end diastole. Note that the A wave will be absent in patients who do not have a distinct atrial contraction, such as those with atrial fibrillation. Since the CVP value should be a reflection of the Right Ventricular End-Diastolic Pressure, the CVP reading is taken at the last half of the A wave at the midpoint of the X descent. Calculate the CVP by averaging the pressure measured at the peak of the A wave and at the subsequent trough.
-
The X descent reflects atrial relaxation.
-
The C wave occurs at the end of the QRS complex at the beginning of the ST segment on the ECG tracing. It reflects closure of the tricuspid valve between the right atrium and right ventricle and the slight bulging of the tricuspid valve during isovolumetric ventricular contraction. The C wave is not always visualized.
-
The V wave occurs at the end of the T wave on the ECG tracing. It reflects the increased pressure during passive atrial filling from IVC.
-
The Y descent occurs prior to the P wave on the ECG tracing. It reflects the opening of the tricuspid valve and the passive flow of blood from the right atrium into the right ventricle prior to atrial contraction.
-
There are three parts of the waveform that are systolic events (c, x, v). There are two parts of the waveform that are diastolic events (a, y). The terms systole and diastole refer to VENTRICULAR events only
-
Mnemonic for the CVP wave
- “a” wave due to atrial contraction
- “c” wave due to tricuspid closure and ventricular contraction
- “v” wave due to venous filling of atrium
-
Tachycardia reduces the time spent in diastole, causing a short “y” descent. This can make the “v” and “a” waves appear to merge.
-
During spontaneous ventilation, a decrease in pleural and pericardial pressures occurs during inspiration – these are pressures that are transmitted to the right atrium. This causes a decrease in the measured CVP (but transmural pressure may actually INCREASE). Mechanical ventilation causes the opposite effect during an forced inspiratory breath
-
Pleural and pericardial pressures are almost equal to atmospheric pressure at end-expiration. This is true with both spontaneous and mechanical ventilation
-
Pericardial Constriction: Limited venous return to heart, elevated CVP, end-diastolic pressure equalization in all cardiac chambers. Prominent “a” and “v” waves, steep “x” and “y” descents.
All hemodynamic measurements are taken at end-expiration. The most accurate method is to obtain an actual printout of the CVP waveform and ECG tracing and average the A wave at end-expiration. The CVP is calculated by averaging the peak and trough of the A wave. The CVP value is recorded at the midpoint in the X descent. In spontaneously breathing patients the CVP baseline will fall during inspiration and rise during expiration. Take the measurement just prior to the baseline fall of inspiration. Patients receiving positive-pressure ventilation exhibit baseline rise during inspiration with baseline fall during expiration. In these patients, take the reading just prior to the rise of inspiration.
The A wave will be absent in patients without distinct atrial contractions, such as those in atrial fibrillation or those with ventricular pacemakers and no atrial activity. How is a CVP obtained in patients without an A wave? In these cases, a reading may be taken on the CVP waveform where it aligns with the end of the QRS complex on the ECG tracing.
PEARLS:
-
Brachial artery doesn’t have collateral circulation but radial and femoral arteries do.
-
Although expiration is normally passive, active expiration is very common in critically ill patients. When expiration is active, contraction of abdominal and thoracic muscles increases pleural pressure during expiration, and there may not be any phase during the respiratory cycle in which pressure measured from a transducer referenced relative to atmospheric pressure gives a close approximation of atrial transmural pressure
-
If the central venous pressure falls by >1 mm Hg during inspiration and this is not due to the relaxation of expiratory muscles, usually the patient will respond to fluids
-
Normally CVP is negative in a normal person in upright position
-
PAWP is accurate if in a Zone III area of the lung where Pa>Pv>PA (alveoli). On X-ray, should be no more than 3-5 cm across the midline. Wedge pressure should always be less than Pulm Diastolic Pressure except in mitral regurg.
-
The length of insertion of PA catheter (cm) to reach various chambers:
- RV 25 cm
- PA 35 cm
- PCWP 45 cm
- In a study by Paul Marik, there was no correlation between CVP and blood volume, or CVP and fluid responsiveness or ΔCVP (change in CVP with inspiration) and fluid responsiveness. Hence, he says that CVP should not be used to predict fluid responsiveness. Even, if the CVP is 0, it doesn’t mean that patient will be fluid responsive. Patients with low CVP can be volume overloaded and high CVP can be volume depleted.
- CVP is a measure of right atrial pressure alone, not right ventricular volume.
- In patients on mechanical ventilation, the right ventricular filling is dependent on transmural right atrial pressure and not CVP.
- BP is directly related to CO and stroke volume (BP= COxSVR= SVxHRxSVR). However, in a study, BP changes after a fluid challenge did not always correlate well with changes in cardiac output. In some patients, there was increase in CO with fluid bolus but no change in BP or there was an improvement in BP but no change in CO or pulse pressure. However, in people who responded to fluid challenge, there was an overall increase in BP, CO and pulse pressure.
- IVC less than 2 cm has 87% chance of CVP less than 10.
- EtCO2 depends on CO2 production in tissues, blood flow to lungs i.e. cardiac output and ability of lungs to clear that returned CO2 i.e. ventilation.