Capnography:
Capnogram is a plot of PCO2 vs. time or volume.
Physiology:
In expired respiratory gases, capnography directly reflects the elimination of CO2 by the lungs to the anesthesia device. Indirectly, it reflects the production of CO2 by tissues and the circulatory transport of CO2 from tissues to the lungs. Thus capnography is an important non-invasive technique that provides information about CO2 production, pulmonary perfusion and alveolar ventilation, respiratory patterns as well as elimination of CO2 from the anesthesia circuit and ventilator.
At the end of inspiration, assuming that there is no rebreathing, the airway and the lungs are filled with CO2-free gases. Carbon dioxide diffuses into the alveoli and equilibrates with the end-alveolar capillary blood (PACO2 = PcCO2 = 40 mm Hg).
The actual concentration of CO2 in the alveoli is determined by the extent of ventilation and perfusion into the alveoli (V/Q ratio). The alveoli with higher ventilation in relation to perfusion (high V/Q alveoli) have lower CO2 compared to alveoli with low V/Q ratio that would have higher CO2. As one moves proximally in the respiratory tract, the concentration of CO2 decreases gradually to zero at some point. The volume of CO2-free gas is termed respiratory dead space and here there is no exchange of oxygen (O2) and CO2 between the inspired gases and the blood. As the patient exhales, a CO2 sensor at the mouth will detect no CO2 as the initial gas sampled will be the CO2-free gas from the dead space. As exhalation continues, CO2 concentration rises gradually and reaches a peak as the CO2 rich gases from the alveoli make their way to the CO2 sensing point at the mouth. At the end of exhalation, the CO2concentration decreases to zero (base line) as the patient commences inhalation of CO2 free gases. The evolution of CO2 from the alveoli to the mouth during exhalation, and inhalation of CO2 free gases during inspiration gives the characteristic shape to the CO2 curve which is identical in all humans with healthy lungs.
When you inhale CO2 free air and exhale, and measure partial pressure of CO2 at the mouth, you get the expiratory phase which is divided into 3 phases:
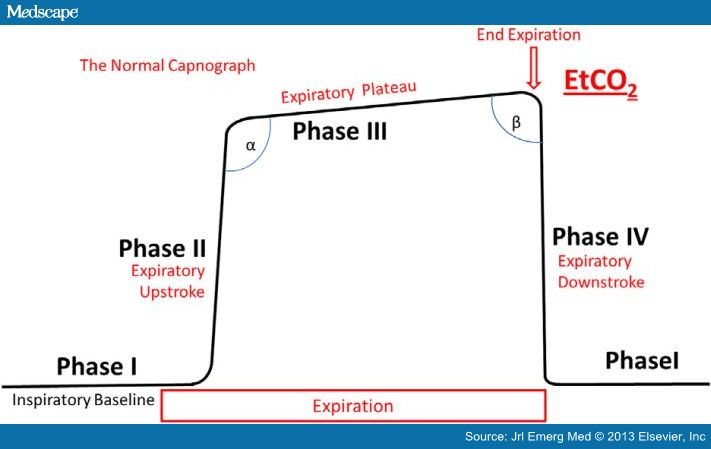
- Phase I: Dead space gases
- Phase II: Dead space gases mix with alveolar gases resulting in the rise of PETCO2
- Phase III: Represent CO2 evolving from alveoli
The height and slope of the alveolar plateau (phase III) is dependent on the CO2 content in the alveoli. The CO2 content is in turn dependent on the V/Q ratio of the alveoli. High V/Q alveoli contain relatively low PCO2, while low V/Q alveoli contain relatively high PCO2.
Hence, it can be concluded that the height and the slope of the alveolar plateau is dependent on ventilation, cardiac output and more importantly on V/Q relationship. In the acute settings, for a given ventilation, EtCO2 is a function of cardiac output (pulmonary perfusion). This is the basic principle of directing the uses of capnography during CPR
If the EtCO2 decreases, it suggests hyperventilation, hypoventilation, or upper airway obstruction depending on the cause. Jaw thrust may relieve upper airway obstruction. Patients on oxygen therapy over mask may have false low EtCO2 due to admixture of exhaled CO2 with O2.
EtCO2 during CPR: Optimize chest compression for effective CPR so that EtCO2 values are between 10 and 20 mm Hg. If EtCO2 values less than 10 mm Hg or less measured after initiation of ACLS is associated with poor outcome. An abrupt increase in PETCO2 may indicate return of spontaneous circulation (ROSC). Increase in pulmonary circulation brings more CO2 into lungs for elimination.
EtCO2 increases with increase in cardiac output and decreases with increase in V/Q ratio. In other words, if there is decreased perfusion to lungs or low cardiac output, then less CO2 will diffuse into alveoli and EtCO2 will be low. Hence, in PE, the EtCO2 will be low and the difference in EtCO2 and PaCO2 will be higher.
The greater the difference in EtCO2 and PaCO2, the greater the alveolar dead space. The (a-ET) PCO2 is a measure of alveolar dead space, and changes in alveolar dead space correlate well with changes in (a-ET) PCO2. An increase in (a-ET) PCO2 suggests an increase in dead space ventilation. Hence (a-ET) PCO2 is an indirect estimate of V/Q mismatching of the lung. (Exception: (a-ET) PCO2 increases with age and emphysema). Negative (a-ET) PCO2 can exist in some conditions but for all practical purposes, that value is very small.
The longer the phase 1, the greater the anatomical dead space. Area under CO2 curve is directly proportional to alveolar ventilation.
PEARLS:
-
EtCO2: Absolute EtCO2 is not important but trend is. The normal range is 36-40mm Hg
-
End tidal CO2 detector changes to yellow if it detects CO2 of at least 4%. However, it is not very sensitive if cardiac output is too low, especially during CPR.
-
Can titrate recruitment by the PaCO2-EtCO2 gradient
-
Increased dead space will increase PaCO2-EtCO2 gradient while a shunt will send CO2 to arterial side that will never reach alveoli.
-
EtCO2 less than 10 during CPR can be either due to poor chest compressions or it can also be due to hyperventilation.
-
EtCO2 <10 after 20 mins indicates that ROSC is highly unlikely. However, this rule doesn’t apply in PE related cardiac arrest.
-